Real Estate Trends

Home Prices and Rents Expected to Rise in 2013

While geopolitical and global economic events could change the forecast going forward, what we see in this survey is confidence that the U.S. real estate economy has weathered the brunt of the recent financial storm and is poised for significant improvement over the next three years.” -Patrick L. Phillips, CEO of the Urban Land Institute.

home prices and rents expected to rise in 2013The Urban Land Institute (ULI) surveyed 38 analysts and real estate economists and released the findings in the Real Estate Consensus Forecast, on Wednesday, March 28. DSNews reviewed the data and compiled a summary. This is a recap of key real estate related facts from the article.

The survey findings contain encouraging news for the real estate industry. Here are the projected trends:

  1. The institute expects housing starts to nearly double by 2014 and projects that home prices will begin to rise in 2013.
  2. According to the Federal Housing Finance Agency (FHFA) data, average home prices are “expected to stabilize” in 2012 and “increase by 2 percent in 2013 and 3.5 percent in 2014.”
  3. Single family housing starts are projected to elevate from the 2011 level of 428,000 to 800,000 in 2014.
  4. According to National Council of Real Estate Investment Fiduciaries (NCREIF) the expected 2012 return rate for apartment investments is 12.1 percent.
  5. Rental rate growth for apartments is forecast at 5 percent for 2012. It is expected to slow to 4 percent in 2013 and drop slightly to 3.8% in 2014.
  6. Unemployment rates are expected to continue to fall, hitting 8 percent by 2012 year-end, 7.5 percent by 2013 year-end and 6.9 percent by 2014 year-end.
  7. GDP is projected to increase by 2.5 percent in 2012 and expand to 3.2 percent in 2014.

The report warned that “with the improving economy is inflation and higher interest rates. These rising rates will increase costs for investors.” These findings together may prompt investors and prospective homebuyers to embrace current interest rates and take the plunge sooner rather than later.

Current markets represent historic buying opportunities for homebuyers and investors. The BidSelect® online marketplace is a powerful database of available properties spanning five channels of business. (Resale, short sale, foreclosure, rental, new construction) The resource features over 30,000 available properties and is free to homebuyers and investors.

For more information, please join us at FirstPrestonHT.com or on our Facebook and Twitter pages.

Top and Bottom First-Time Homebuyer Markets

Top and Bottom first time homebuyer marketsHousingwire Magazine profiled first-time homebuyers and first-time homebuyer markets in their March 2012 Investments Issue. Their research indicated home affordability, neighborhood safety and school quality are top criteria for first-time homebuyers.

Their list of top first-time buyer markets and bottom first-time homebuyer Markets utilized data from sources such as: The National Association of Home Builders, the U.S. Department of Education and the Federal Bureau of Investigation.

The rankings analyzed school quality, crime rate and unemployment rates to rank the 40 most affordable housing markets and the 40 least affordable markets.  Local school quality figures were given less weight than state school indicators because of the lack of availability of local stats. Here are the top five and bottom five, first-time homebuyer markets for 2012:

Top First-Time Homebuyer Markets

  1. Quad Cities, Iowa-Illinois
  2. Houston, TX
  3. Wichita, KS
  4. Lancaster, PA
  5. Lima, OH

Bottom First-Time Homebuyer Markets

  1. New York, NY
  2. Los Angeles, CA
  3. San Francisco, CA
  4. Orange County, CA
  5. Ocean City, NJ

Markets change constantly. As always, independent research with the help of a real estate professional is recommended.

For more information, please join us at FirstPrestonHT.com or on our Facebook and Twitter pages.


Source:  Housingwire Magazine.  First Home Hunting by Justin T. Hilley, Housingwire Magazine March 2012 Flip book article on Top and Bottom First-Time Homebuyer Markets. 

Top and Bottom Home-Flipper Markets

Home Flipper MarketsHousingwire Magazine’s March issue ranks several housing markets by buyer types. They are profiled into four categories: REO flipper, distressed property investor, second-time homebuyer and first time homebuyer. Each buyer type is profiled and interesting insights are offered about what appeals to each buyer type. We will recap the profiles for your review and feedback; beginning with the Top and Bottom Five “Flipper Markets.” The “Flipper” profile is limited to the “REO/abandoned/auction space. This is the couple of guys working on one home at a time crowd.”

Top Five “Home-Flipper Markets”

  1. Riverside, CA
  2. Washington, DC
  3. Salt Lake City, UT
  4. Phoenix, AZ
  5. Miami, FL
  6. Wild Card – Los Angeles, CA

The Bottom 5 “Home-Flipper Markets”

  1. New York, NY
  2. Chicago, IL
  3. Las Vegas, NV
  4. Detroit, MI
  5. Atlanta, GA

Top Five “Home-Flipper Markets” Key Stats

Riverside, CA – More FHA insured mortgages since 2008 than any US Metro at over 3500, totaling $671 million; second only to LA. Reo saturation is 42.2%. Formerly among top five foreclosure markets, recovering as unemployment dropped from 14.5% November 2010 to 12.5% in November2011.

Washington, DC – Great employment rate at 5.4%.  FHA insured over 1420 waiver mortgages since 2008 for $343 million.  REO saturation rate is low at 11.8%. Industry analyst Clear Capital projects 9.3% growth in home prices in 2012.

Salt Lake City, UT – Unemployment rate: 5.6%. #Waive Loans: 258 for $44.9 million. Strong demand. Expected 1%-3% home price increase this year.

Phoenix, AZ – Unemployment 7.7% in November. Projected 2012   saturation rate of 32.9%. Foreign buyers common. FHA insured over 3600 loans for $500 million on flipped homes.

Miami, FL – Unemployment 9.4% in November, down from previous year. Projected 2012 REO saturation rate of 31.3% with an 8.8 % growth in home prices.

Los Angeles – Unemployment 10.7%. FHA covered 2,378 loans for $633 million in funding for flipped properties.REO Saturation 28.9%. Clear Channel projects 10.3% price depreciation in 2012.

Five Bottom Home-Flipper Markets Key Stats

New York, NY – Unemployment 8.3% in November 2011. Only 228 FHA waiver loans were covered for $85.1 million. Avg. foreclosure timeframe 1,019 days. REO Saturation 7%.

Chicago, IL – Unemployment rate increased to 9.6% versus prior year.  Only 228 FHA waiver loans as $96.4 million written. Borrowers must be provided city-funded legal assistance to fight foreclosures. REO Saturation 29.9%, with housing prices expected to drop 5.2% in 2012.

Las Vegas, NV – Unemployment 12.5%. FHA participation in 1864 loans to flip-buyers for a total of $257 million. Per Housingwire, “highest foreclosure rate in the country.”

Detroit, MI – Unemployment fell to 9.5% in November. 149 FHA loans for a total of just $14.3 million. REO saturation high at 48.8%.

Atlanta, GA – Unemployment 9.2%. Clear Capital predicts prices will plunge 14.4% in 2012. Approximately 1000 FHA waiver loans equated to roughly $119 million. REO saturation 42.4%.


Note: Markets change constantly. As always independent research with the help of a real estate professional is recommended.

Source: Housingwire Magazine, March 2012 Investments Issue.  

Top Five and Bottom Five Distressed Property Markets

Distressed PropertiesHousingwire Magazine took on the task of ranking the top five and bottom five distressed property markets in their March issue.  The rankings were preceded by an overview of the selection methodology. The tabulation criteria for the rankings included:  “Unemployment, year –to-date change in foreclosure filings, average discount on distressed-home sales compared with normal transactions and the length of the foreclosure timeline in the respective state. Foreclosure data comes from RealtyTrac and unemployment data is from the U.S. Department of Labor.”

The analysis is basically a measure of which markets were found to be most and least attractive to large scale investors who often employ a buy, rent and hold strategy.

Cities ranked high on the list of “Top Distressed Property Markets” are typically cities with significant quantities of steeply discounted inventory, and major upside profit potential.  “Bottom Distressed Property Markets”   are often those with healthy economic profiles, low unemployment levels, low foreclosure inventories and slow but steady price appreciation.

Being on either list has an upside.  Markets that are in recovery are often attractive to investors and rank among the “top distressed markets” while markets which have already recovered and have price appreciation are typically less attractive for investors and rank among the “bottom distressed markets.”  Markets with higher unemployment rates are almost always less appealing to investors.

Top Distressed Property Markets

  1. Minneapolis-St. Paul  – Not a foreclosure hotbed.  Good economy. Significant foreclosure inventory.  Low unemployment at 5.1%. Foreclosures down 44% year over year. Non-judicial foreclosures take  only 184 days.(4th Qtr. 2011)
  2. Houston – State laws favorable to investors. Nation’s shortest foreclosure interval at 90 days. Foreclosed property discount averages 38%. (3rd Qtr. 2011) Low unemployment at 7.6%.
  3. Phoenix  – High volume of foreclosures following “dire market collapse”.  Foreclosure discount rate of 26%. Investors “looking to ride a potential market rebound.”
  4. Atlanta – High inventory of foreclosures—48,500 filings, 37% lower than previous year. Buyers captured property discounts of nearly 50% during 2011. Non-judicial foreclosure timeline: 142 days. Unemployment at 9.2% in November.
  5. San Francisco – Bay Area buyers enjoyed 51% discount on third quarter REO sales. Relatively low unemployment rate of 8.7% compared more favorably than Los Angeles options.

Bottom Distressed Property Markets

  1. San Joaquin Valley, CA – (Bakersfield, Fresno, Modesto, and Stockton)—High unemployment 13.4 % (Bakersfield)-15.7% (Fresno). Low avg. foreclosure discount and low “year-over-year change in distressed filings.”  Low foreclosure inventory potential at 8,000 filings compared to 48,500 for Atlanta.
  2. Las Vegas  – High unemployment of 12.5% hampers re-emerging   economy. Market gains contribute to the low 20% average REO discount compared to private home sales. Foreclosure timeline of 390 days slows availability of inventory.
  3. Tampa  – Judicial foreclosure timeline: 806 days.  Foreclosure discount of just 25% is not as enticing to investors as other markets.  Unemployment rate: 10.3%.
  4. New York City – Foreclosure timeline averaged a whooping 1,019 days (nearly 3 years) in the fourth quarter of 2011, possibly nation’s longest.
  5. San Antonio – Ranks high in “best-place-to-live” surveys. Housing prices are appreciating rather than depreciating. City is not as attractive to investors because of low number of foreclosure filings – 5,503 versus 48,500 in Atlanta for example. Appreciating property values deter investors seeking steep discounts.

Markets change constantly. As always independent research with the help of a real estate professional is recommended.

For additional information, please join us at FirstPrestonHT.com or on our Facebook and Twitter pages.

Source: Housingwire Magazine. The 2012 Investments Issue.  Article: Distressed Opportunities, Larger Players Prep to Enter the Market.


Housing Affordability at All Time High…Again!

Housing affordabilityIn January the National Association of Realtors (NAR), Housing Affordability Index soared to 206.1. “This is the first time the housing affordability index has broken the two hundred mark, meaning the typical family has roughly double the income needed to purchase a median-priced home,” stated NAR President Moe Veissi.

NAR announced that the Housing Affordability Index has hit the highest level in recorded history.  The recordkeeping for the index began in 1970. From a historical perspective, in 1970 the average price of a gallon of gas was 36 cents; median price of a new home was $26,600; and the average price of a loaf of bread was 36 cents.

The index is designed so that a score of 100 indicates that a median-income family could qualify for a median priced existing single family home. (Index assumes 20 percent down payment with 25 percent of gross income allocated to mortgage principal and interest) “For buyers who can qualify for a mortgage, now is a very good time to become a homeowner,” declared Veissi.

The NAR President projected, “If access to credit improves, we could see a much more meaningful increase in home sales and broader stabilization in home prices with modest gains in areas with stronger job growth.”

Housing analysts forecast little change in mortgage interest rates and housing prices during the remainder of 2012; therefore affordability is expected to remain strong through year’s end.

For additional information, please join us at FirstPrestonHT.com or on our Facebook and Twitter pages.

Source: National Association of Realtors, REALTOR.org, Article: Housing Affordability Index Hits Record High. Published March 6, 2012

Housing Industry Projections Bullish for 2012

Housing Industry Projections Bullish for 2012Two major economists expect big gains in housing in 2012.  David Crowe, chief economist at the National Association of Home Builders, published his forecast calling for a 17% increase in housing starts overall and 17% increase in single-family starts as well. Crowe anticipates a “significant increase” in new home sales in 2013.

An even more optimistic view is from Moody’s Analytics, as published by Julie Schmit at USA Today.  Moody’s predicts that “existing home sales will rise 12% this year, and new home sales, coming off a horrid year, will jump 74% this year.”

Moody’s is upbeat about single-family housing starts, forecasting that “they will rise 37% this year, after falling 9% last year.”

The preceding thumbnail recaps were compiled and reported by Calculated Risk, a noteworthy finance and economics analyst firm, via their blog at calculatedriskblog.com.

Are you bullish or bearish on this year’s projected housing trends? What do you think of the projections of the analysts?

For additional information, please join us at FirstPrestonHT.com or on our Facebook and Twitter pages.

Price Gains Predicted for 50 Major Metro Markets

Price Gains Predicted for 50 Major Metro MarketsClear Capital’s latest monthly Home Data Index™ indicates market stability is forecasted for 2012. If prices turn upward as predicted, this will be the “first time since 2006 that the change in annual home prices has landed in positive territory.” DSNews.com published a recap of the study on January 8.

The major metro markets that have seen some of the most extreme pricing swings are:

2011 Positive Price Growth:

  1. Dayton, OH     11.5%
  2. Orlando, FL        6.7%
  3. Miami, FL           5.6%

 2011 Price Declines:

  1. Atlanta, GA       18.3%
  2. Seattle, WA       15.1%
  3. Birmingham, AL 11.1%
  4. Detroit, MI        10.8%

The key conclusion:  In 2012, Clear Capital is forecasting U.S. home prices to show continued stabilization, with a slight gain of 0.2 percent across all markets.  That would put national home prices near levels not seen since 2001.

For additional information, please join us at FirstPrestonHT.com or on our Facebook and Twitter pages.

60 Brands “Poised to Dominate” 2012

brands poised to dominate 2012Industry experts at AGBeat have analyzed hundreds of companies to identify those on track to make a major impact during 2012. Many of the companies offer products or services that target the real estate industry.

Check out the thumbnail descriptions to see why they are on the fast track. When a prospect or customer rattles off one of these “movers and shakers,” you’ll be in the know.

Which are “most likely to succeed” from your perspective?

For additional information, please join us at FirstPrestonHT.com or on our Facebook and Twitter pages.

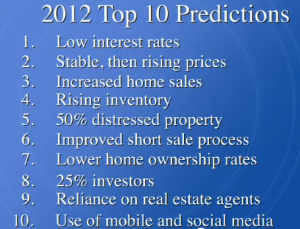
Top 10 Housing Predictions for 2012

top ten housing predictionsRE/MAX Co-Founder and Chairman, Dave Liniger, sees positive possibilities ahead for 2012. His top 10 predictions are explained in a three minute, sixteen second YouTube video.

Liniger anticipates opportunity on the horizon as college graduates gear up to exit parental nests. Changing market conditions are expected to have a positive impact on consumer reliance on real estate professionals.

What residential real estate trends do you foresee in 2012?  How will you capitalize on them?

real estate predictionsFor additional information, please join us at FirstPrestonHT.com or on our Facebook and Twitter pages.

Top 5 Cities for Rental Ownership

Top 5 Cities for Rental OwnershipMarket watchers indicate we are in a historically positive time for owning and leasing rental property. Studies indicate vacancy rates are decreasing and rents are increasing. Many investors have decided the “buy, rent and hold” investment strategy is a winning one for the foreseeable future.

A recent report from Local Market Monitor (Posted in AGBeat) listed Houston as the “most rewarding city for being a landlord.” The rating is based on “home prices, area economy and rents and ranked by job growth.” Below are the four markets rounding out the list of “Top Five Cities for Landlording?

1. Houston, TX

Projected 3-year rent increase: 18%
Q2 home price: $174,000
Current monthly rent: $818
Annual job growth: 2.5%

2. Grand Rapids, MI

Projected 3-year rent increase: 15%
Q2 home price: $128,000
Current monthly rent: $785
Annual job growth: 2.4%

3. Rochester, NY

Projected 3-year rent increase: 25%
Q2 home price: $148,000
Current monthly rent: $785
Annual job growth: 2.3%

4. Dallas, TX

Projected 3-year rent increase: 16%
Q2 home price: $166,000
Current monthly rent: $877
Annual job growth: 2.2%

5. Tulsa, OK

Projected 3-year rent increase: 19%
Q2 home price: $146,000
Current monthly rent: $671
Annual job growth: 1.8

For additional information, please join us at FirstPrestonHT.com or on our Facebook and Twitter pages.