Archives Admin User

AMERICA’S 25 TOP PERFORMING CITIES

Are large cities in your region among the top performing cities or among the biggest decliners? As the economy recovers, why have some cities led the way, while others struggle? What are the common denominators for biggest gainers versus biggest decliners? What impact will top performing cities have on local real estate markets around the country?top-performing-cities

The Milken Institute, a nonprofit, nonpartisan think tank and economic analyst, measures the economic health of large and small metros each year. The result is a ranking by city of 200 major metros and 179 small cities in the annual Best-Performing Cities Report.

FINDINGS

Large metros with healthy job growth dominated the rankings.  This year’s top spots went to cities blessed with technology centers, financial and insurance services, vast natural resources, and healthy concentrations of industry– especially manufacturing.  Job growth promoted economic stability propelling housing demand and recovery for top cities.

TOP 25 BEST-PERFORMING LARGE METRO AREAS

According to Milken Institute findings, the 2012 top 25 performing large cities/ metro areas are:

Top-Performing-Cities

Salt Lake City in Top Performing Cities

  1. San Jose-Sunnyvale-Santa Clara, CA
  2. Austin-Round Rock-San Marcos, TX
  3. Raleigh-Cary, NC
  4. Houston-Sugar Land-Baytown, TX
  5. Washington-Arlington-Alexandria, DC-VA, MD, WV
  6. Salt Lake City, UT
  7. Provo-Orem, UT
  8. Cambridge-Newton-Framingham, MA
  9. Charleston-North Charleston-Summerville, SC
  10. Fort Worth-Arlington, TX
  11. New York-White Plains-Wayne, NY-NJ

    Top-Performing-Cities

    Boulder Colorado in Top Performing Cities

  12. Fort Collins-Loveland, CO
  13. Seattle-Bellevue-Everett, WA
  14. Dallas-Plano-Irving, TX
  15. Boulder, CO
  16. Kennewick-Pasco-Richland, WA
  17. Peabody, MA
  18. El Paso, TX
  19. Bakersfield-Delano, CA
  20. Lubbock, TX
  21. Durham-Chapel Hill, NC
  22. San Antonio-New Braunfels, TX
  23. Portland-Vancouver-Hillsboro, OR-WA
  24. Lafayette, LA
  25. Knoxville, TN

To see how all 200 metros ranked, or to download the full 200 large cities ranking report, visit the Milken Institute.org.

To conduct property searches in cities throughout the nation visit FirstPrestonHT.com or BidSelect.com

For real estate portfolio management and real estate technology solutions, visit FirstPrestonHT.com

Source: Milken Institute. Best-Performing Cities 2012. Ross C. DeVol, Armen Bedroussian, Yu Liu. January 2013.

2012 Best Performing Small Cities | First Preston HT

Real estate’s next frontier may be small metros with hot job growth and high demand for housing. The Milken Institute, known for publishing the 2012 Best Performing Large Cities report, also produces the 2012 Best Performing Small Cities rankings.  The 2012 index analyzes 179 small metro areas.

top-small-citiesThe latest class of top 10 honorees all benefit from one or more of the following three  components.

  1. Stable public sector employment. (College or university towns, key research centers)
  2.  A growing energy sector
  3. Thriving high-tech sector

Six of top 10 small cities are alumnae of the 2011 rankings. These markets were immune to the housing collapse as their slow but steady housing markets never experienced a housing bubble.

The real estate appreciation outlook is strong in these markets. Residential sales and investment are expected to thrive provided sufficient inventory is available.

Top 10 Best Performing Small Cities for 2012:

  1. Logan, UT-ID — Utah State University
  2. Morgantown, WV — West Virginia University
  3. Bismarck, ND  — Oil boom. Well funded state government and infrastructure.
  4. Odessa, TX —  Energy boom kindled 8.5% growth in employment.
  5. Fargo, ND-MN — Oil boom. Steady healthcare and education centers.
  6. Longview, TX — Gas production and mining. Diversified economy.
  7. State College, PA — Penn State University. Gas pipeline.
  8. Midland, TX — Permian basin energy center.
  9. Tyler, TX — Healthcare and telecom hub.
  10. Columbia, MO — Certified industrial sites and a multiple stable employment bases.

To check out the rankings for all 179 metros or to download the full Best Performing Cities 2012 ranking report, visit Milken Institute.org.

To conduct property searches in cities throughout the nation visit FirstPrestonHT.com or BidSelect.com

For real estate portfolio management and real estate technology solutions, visit FirstPrestonHT.com

Source: Milken Institute. Best-Performing Cities 2012. Ross C. DeVol, Armen Bedroussian, Yu Liu. January 2013.
Latest Improving Markets Index Figures Show Strength for Housing Recovery

The Improving Markets Index released by the NAHB for the month of February gives homeowners across the nation reason to rejoice. Packed with positive numbers and more metros being added for the sixth consecutive month, it is hard to deny the housing recovery. The Improving Markets Index highlights metro areas that have shown growth for six consecutive months in three distinct categories. If a market is listed in the Improving Markets Index, it means it has seen an increase in permits, growth in employment stats as provided by the Bureau of Labor statistics, and home values have appreciated as reported by Freddie Mac.

In fact, every state—and the District of Columbia—now have at least one metro listed in the Improving Markets Index. The total Improving-Market-Index-First-Prestonnumber of improving markets increased from 242 in January to 259 in February, with some of the newest additions being Fort Wayne, Ind., and Albuquerque, N.M. The complete list of metros can be viewed in the report here. NAHB Chief Economist David Crowe said, “Just over 70 percent of the 361 metros covered by the Improving Markets Index are listed as improving this month.” This report was created to spotlight areas showing growth and consistent   progress  overall, often spotlighting metros  that were not covered  in most national news stories at the time. When the NAHB began quantifying and measuring the data and identifying the markets that were improving in September  2011, the first report included only 12 metros.

One positive side effect of growth in a particular market is that potentially fewer homeowners will be upside down in terms of their home’s value. Increased consumer confidence also occurs when the three areas measured in the Improving Markets Index—employment growth, house appreciation and permit growth—show momentum. While the housing market is not projected to see huge gains overnight, as it experienced in its most recent boom, this recovery is expected to be more steady and solid.

For more information about First Preston HT, please visit FirstPrestonHt.com. You can also join our community on Facebook and Twitter.


Sources:

1)      http://www.nahb.org/reference_list.aspx?sectionID=2223

2)      http://www.nahb.org/news_details.aspx?sectionID=2223&newsID=15783

Demand for homes up, builders facing challenges in March Housing Market Index

The NAHB released its latest Housing Market Index March 18th and it showed a much sunnier outlook on behalf of builders when compared with this time last year. The component in the Housing Market Index representing builder traffic jumped three points in March to 35 and the component reflecting sales expectations from builders increased one point to 51. A total score of the three components over 50 denotes that more builders view market conditions as good versus poor. Overall builder confidence slipped two points to 44 making it the third consecutive month of decreases.

NAHB chairman Rick Judson pointed to logistical issues such as the lack of availability of lots and the cost of materials as two of the reasons for the builders concern. The skilled trades manpower component also played a part in this latest decline in the Housing Market Index. NAHB housing market indexchief economist David Crowe was quoted as stating “During the Great Recession, the industry lost home building firms, building material production capacity, workers who retreated to other sectors and the pipeline of developed lots.” Indeed, after the market began to crash many employees of builders, even entire companies were forced to look elsewhere for employment. Whether it was layoff of personnel or smaller builders shuttering their doors to explore other options such as commercial construction, the new home industry lost significant depth in this area.

Another concern of US homebuilders reflected in the Housing Market Index is the persistence of credit availability being limited for some consumers. Gone are the days of stated income loans, and consumers are wary of variable interest rate and interest only loans. The criteria are strict even for well qualified buyers now. This has not gone unnoticed by the homebuilding community. Even with the increased demand for new construction, the Housing Market Index for March sends the clear message that there are still hurdles in the path to a full housing recovery.

For more information on First Preston HT visit our website at FirstPrestonHT.com.

February Housing Starts Summary reflect major year-over-year growth in new home demand

The March Housing Starts Summary shows privately-owned housing starts increased to a seasonally adjusted annual rate of 917,000, up 0.8 percent over January’s estimate and up more than 27 percent year over year.

Housing Starts SummaryThe February Housing Starts Summary demonstrates a continuation of the trend seen over the past two years—rising prices, increased housing starts and permits, with decreased time on market for resale homes. In short, the housing comeback is gaining steam and on track for future growth. Consumers and builders alike are taking notice.
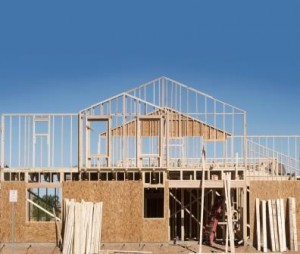
Single-family
Home construction starts for February increased 0.5 percent over January’s numbers to an annual rate of 618,000; a year over year increase of 31.5 percent.

Multi-Family
The rate of starts for buildings with five or more units was 285,000, up from last February 2012’s numbers of 233,000.

Housing Completions
The rate of completions for single-family homes was 574,000, an increase of 3.6 percent, per the Housing Starts Summary. This is another key indicator of overall demand in the housing market.

Building Permits
The Housing Starts Summary also noted an increase in privately-owned housing permits of 4.6 percent above the January rate to 946,000, which exceeds last February’s estimate by 33.8 percent.

Single –family permits increased 2.7 percent over January’s numbers.

While buyers look to builders for homes, builders express some frustration amid all the consumer demand. NAHB Chairman Rick Judson stated that builder’s enthusiasm is “tempered by frustrating bottlenecks in the supply of developed lots and rising costs of building and labor.” Two concerns Judson mentioned include below market appraisals and credit availability. Although the conditions for borrowers and builders might not be perfect, several elements contributing to growth and demand are in place. A key factor influencing homebuyers to purchase new construction is the shortage of inventory in the resale market. Inventory has continued to decrease across the country in the majority of metros. The February Housing Starts Summary showed modest month-over-month gains and strong year-over-year gains. The big picture is clear: demand for new homes is on the rise.

For more information about First Preston HT, please visit FirstPrestonHT.com.


Housing Starts Summary: Starts Temporarily Slowed, Permits on the Rise

Housing starts were down for the month of January 2013, according to the U.S. Department of Commerce. Single family starts declined while multi-family starts varied drastically by region.  In several ways the  decline in housing starts is both a positive and  a negative.  Overall housing starts (all types) decreased 8.5 percent in January to a seasonally adjusted annual rate of 890,000. The number is lower than the projected rate of 914,000 provided by economists in a poll conducted by MarketWatch.

Housing-Starts-SummaryIn a more in-depth analysis of the data provided by the government on Housing Starts for January, a few key factors stand out. Single family housing starts increased slightly at 0.8 percent, a rate of 613,000. The good news here is that the slowdown gives homebuilders a chance to catch up to the ever-increasing demand for newer homes.  The National Association of REALTORS® (NAR) continues to report median price increases as well as decreased inventory in many markets across the country. Andrew Grantham of CIBC World Markets notes that housing starts are still behind household formation, he expects homebuilding to remain on an upswing into 2014.

Multi-family units experienced mixed results. Starts for two or more unit structures fell 24 percent to 277,000, with starts in the Midwest and Northeast down 50 percent and 35 percent, respectively. South and West regions reported increases of 17 percent and 4 percent, respectively.

Long-term implications bode well, with permits up 1.8 percent to 925,000—the largest increase since June 2008. For more information about First Preston HT, please visit our website at FirstPrestonHT.com. You can also join our community on Facebook and Twitter.

Sources:

1) http://articles.marketwatch.com/2013-02-20/economy/37188808_1_annual-rate-level-of-construction-activity-andrew-grantham

2) http://www.realtor.org/news-releases/2013/02/january-pending-home-sales-up-in-all-regions

3) http://www.census.gov/construction/nrc/pdf/newresconst.pdf

HOUSING MARKET INDEX – Highest Level since April 2006 – JANUARY SUMMARY | NAHB/WELLS FARGO HMI

A steady level for the housing market index in January marks a strong beginning of the year for builders of new, single-family homes in the U.S. This is a continuation of an eight-month gradual climb back to stability for the housing market that has brought figures to the highest levels since April 2006.

Housing-Market

Housing Market Index

January: Fiscal Cliff and Other ‘Uncertainties’

The housing market index, a survey designed by the National Association of Home Builders (NAHB) and Wells Fargo to measure builder confidence and sales expectations in the industry, has remained at around 50, close to the same levels as last month. Builders’ views on the market appear to be divided between good and poor. Much of the confidence was shaken by last month’s fiscal cliff negotiations, as well as ongoing policy discussions regarding spending cuts and mortgage interest deductions.

Nevertheless, NAHB chairman Barry Rutenberg points out that if the numbers are any indication, the future of the housing market is looking bright this year. ( Add this as a strong statement for the opening) This is further supported by the gradual improvement shown by many markets in the industry, signaling slow but certain recovery.

Housing Market Index: Other Numbers

In spite of the seemingly cautious views of the steadiness of the numbers, the survey showed promise overall for the housing market in the next six months. Several additional figures in the housing market index for January are worth noting:

  • The current sales condition component of the HMI remained at 51, unchanged from last month.
  • The component measuring sales expectations in the housing market for the next six months fell one point to 49.
  • The prospective buyer traffic component gained one point from last month, rising to 37.
  • At 36 and 50, respectively, the Northeast and Midwest regions posted two-point gains for the HMI three-month moving average. The South gained three points for a total of 49, while the West posted the largest increase at four points to 51.

To search for available real estate or property management resources nationwide, visit

FirstPrestonHT.com. You can also connect with us on Facebook and Twitter.

Source:

Housing Recovery in Full Swing; Improving Markets Index Indicates Increase

The March 2013 Improving Markets Index, released by the National Association of Home Builders on the 21st, shows a seventh straight month of expansion in the number of metros included in the report. Specifically, 34 new markets joined the NAHB/First American Improving Markets Index. Of the 361 metro areas covered in this monthly report, 274 made it onto the improving list, which is more than 75 percent of the markets surveyed, according to NAHB Chief Economist David Crowe. These numbers point to what real estate and economic professionals are calling the tip of the iceberg and the return of a healthy housing sector.

Improving Markets Index

For an area or market to be considered “improving” it must have posted positive numbers in employment, housing permits pulled and housing prices for a minimum of six consecutive months. Real estate professionals in every state are reporting an uptick in the demand for housing, as well as an increasing number of areas reflecting gains in home values.

Although every state is represented in the Improving Markets Index for the second consecutive month, 19 areas were dropped from the report, including Santa Cruz, CA.; Springfield, IL.; and Utica, NY.  Kurt Pfotenhauer, the vice chairman of First American Title, said that while some uncertainties in the regulatory arena remain, “we are finally seeing what could be a broad and deep recovery of the nation’s housing markets.”

Areas new to the latest Improving Markets Index include Birmingham, AL.; Napa, CA.; Colorado Springs, CO.; Gainesville, FL.; Augusta, GA.; and Bloomington, IL.

The following areas returned to the list: Orlando, FL.; Boise City, ID; Chicago, IL.; Honolulu, HI; Athens, GA.; and San Antonio, TX.

For more information about First Preston HT, visit our website at FirstPrestonHT.com.

Housing Market Index Shows Stability after Healthy Growth in 2012

The National Association of Home Builders (NAHB) and Wells Fargo released the latest Housing Market Index this month, which showed continued stability and growth in the housing market and overall positive expectations among builders nationwide.

Housing Market IndexThe NAHB Housing Market Index is a monthly report rating traffic through new home communities and expectations in relation to sales and growth.  It has been conducted for the past 25 years.  This most recent report reflects an overall decrease of one point to 46, on a scale where more than 50 indicates builders feel the market is good versus poor or fair. On the whole, the February report indicates stability in builder confidence, hovering close to its strongest rating since May 2006.

There are several components to the Housing Market Index, one of which relates to sales expectations.  The component reflecting sales expectations for the next 6 months rose one point to 51, demonstrating a national trend of increasing demand for new homes. While issues such as the rising cost of building materials and uncertain job growth do continue to factor into the figures, 2012 showed solid gains and moderate growth. NAHB Chairman Rick Judson, himself a North Carolina home builder, predicts moderate growth for 2013, tempered slightly by previously mentioned issues such as cost of materials, availability of labor in some regions, and customers’ ability to access mortgage credit.

According to Lawrence Yun, Chief Economist for the National Association of REALTORS® (NAR) predicts increasing demand for new homes with the potential for shortages and rapid price gains. It would seem that the nation’s homebuyers are indeed ready and willing to purchase new homes at an increasing pace. In fact, NAR predicts new home sales will grow from 368,000 in 2012 to as many as 575,000 in 2013.

For more information about First Preston HT, visit our website at FirstPrestonHT.com. You can also join our community on Facebook and Twitter.


Sources:

NAHB® National Association of Home Builders

-New construction rises from the ashes, Baldwin Park Living

First Preston HT ® Celebrates 25 Years

Dallas -based First First Preston HT,  will  celebrate 25 years of business success on Thursday, February 14th. What began as a small woman-owned business has become a respected industry leader providing innovative and effective technology and service solutions to its clients. Major clients include leading lenders, government-sponsored entities, federal government agencies and private sector firms.  

To learn more about the First Preston HT family of companies visit www.FirstPrestonHT.com .  Find us on Facebook or follow on Twitter.